折扣爆料
折扣好货实时更新
The last two Learns-Its looked at the demand and supply curves in some detail. Now we need to bring these two things together to find the equilibrium price. After all, the market for any good or service needs buyers and sellers. The demand curve represents the actions, at any price level, of the buyers (or consumers). The supply curve represents the actions, at any price level, of the sellers (or firms, or producers). To find out what the price level will actually be, we need to see what happens when we combine the demand and supply curves.
过去的两次学习中,我们比较详细地了解了需求和供应曲线。现在,我们需要把这两件事结合起来,找到平衡价格。毕竟,任何商品或服务的市场都需要买家和卖家。需求曲线代表了买家(或消费者)在任何价格水平上的行为。供给曲线代表卖家(或公司,或生产商)在任何价格水平上的行为。为了找出价格水平的实际情况,我们需要看看当我们把需求曲线和供给曲线结合起来时会发生什么。

Some of the textbooks you have read may have referred to the price mechanism. This is the mechanism through which the price is determined in a market system. Basically, the price will adjust until supply equals demand, at which point we have the equilibrium price.
The dictionary definition of 'equilibrium' is 'a state of physical balance', or put more simply, 'a state of rest'. As you will see in the following diagrams, any given market is only 'at rest' when supply equals demand, which is where the two curves cross.
你读过的一些教科书可能提到了价格机制。这是在市场体系中决定价格的机制。基本上,价格会调整,直到供应等于需求,在这一点上我们有平衡价格。
字典上对 "平衡 "的定义是 "一种物理平衡状态",或者更简单地说,"一种休息状态"。正如你在下面的图表中看到的,任何给定的市场只有在供应等于需求时才是 "静止 "的,也就是两条曲线交叉的地方。
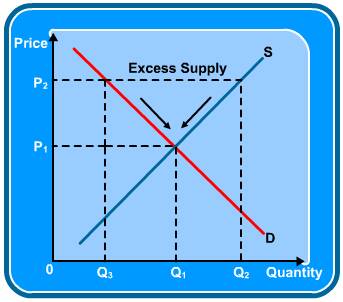
In the diagram above, let us assume that the price is P2 temporarily. At this price, demand is quite low (Q3) but firms wish to supply quite a lot (Q2). We have excess supply equal to Q2 - Q3. Firms find that they have a glut of unsold goods. This is not a 'state of rest'. If you were one of those firms, what would you do? I would probably reduce the price a little (have a sale, maybe?) until I could sell off all my excess stock. Applying this to the diagram, the price would fall until firms reached a position where they no longer experienced excess supply. This occurs where supply equals demand, price P1, quantity Q1. You may have heard of the 'invisible hand', Adam Smith's famous metaphor that tries to explain what is going on here. Nothing physically forces the price down; it just happens naturally, or 'invisibly'!
在上图中,让我们假设价格暂时为P2。在这个价格下,需求相当低(Q3),但企业希望供应相当多(Q2)。我们的过剩供给等于Q2-Q3。企业发现,他们有大量未售出的货物。这不是一种 "休息状态"。如果你是这些公司之一,你会怎么做?我可能会降低一点价格(也许会进行销售),直到我能够卖掉所有多余的库存。把这一点应用到图中,价格会下降,直到企业达到不再有过剩供应的位置。这发生在供应等于需求的地方,价格P1,数量Q1。你可能听说过 "看不见的手",亚当-斯密的著名比喻,试图解释这里发生的事情。没有什么东西迫使价格下降;它只是自然而然地发生,或者说 "看不见的"!"。

Now let us assume that the price is P3 temporarily. Now we have a situation when the price is relatively low, so the demand for the product (Q4) is much higher than the amount firms wish to supply (Q5). We have excess demand equal to Q4 - Q5. Now firms find that they sell their stock very easily and there are customers queuing at the door wanting more! What would you do this time if you were one of those firms? I would be thinking that I could get away with raising my price given the popularity of the good. I would keep doing this until there were no longer queues outside my door and the demand for my product matched the amount I supplied. Again, this will occur where supply equals demand, price P1, quantity Q1. The invisible hand is at work again!
现在让我们假设价格暂时为P3。现在我们有一种情况,即价格相对较低,所以对产品的需求(Q4)远远高于企业希望供应的数量(Q5)。我们的过剩需求等于Q4-Q5。现在企业发现,他们的库存很容易卖掉,而且还有顾客在门口排队,想要更多的东西!这时,如果你想做什么?如果你是这些公司之一,这次你会怎么做?我会想,考虑到商品的受欢迎程度,我可以不提高价格。我会一直这样做,直到门外不再有排队的人,对我的产品的需求与我的供应量相匹配。同样,这将发生在供应等于需求的地方,价格P1,数量Q1。无形的手又开始工作了

In the last two Learn-Its, we looked at why supply and demand curves might shift. We can now look at how these shifts can affect the equilibrium price.
在上两节课中,我们研究了为什么供应和需求曲线会发生变化。现在我们可以看看这些转变会如何影响均衡价格。

The original equilibrium price is P1, quantity Q1. We are at a 'state of rest'. Now assume that one of the determinants of demand changes. For instance, there may have been an increase in advertising in the industry. This will shift the demand curve to the right, ceteris paribus (D2). The price will not stay at P1 for much longer. We have an excess demand situation (A to C). As stated above, this will cause the price to be bid up, and this will keep going until we reach the new equilibrium price where the new demand curve crosses the supply curve (at point B). Note that there has been a shift in the demand curve, but only a movement along the supply curve. None of the determinants of supply have changed.
Earlier, we called this process the 'price mechanism'. From the analysis above, we can see that the price itself has the most important role. The rising price has acted as a signal to possible new firms who might want to join this expanding industry. It acted as an incentive, encouraging existing firms to produce more (the movement along the supply curve). It also acted as a sort of rationing device in the sense that it put off some existing buyers and helped make sure that demand matched supply.
You can probably see that there are three other diagrams that I could draw: a shift to the left of the demand curve; a shift to the right of the supply curve and a shift to the left of the supply curve, all assuming ceteris paribus. You should be able to think of reasons why any one of those curves might shift (ceteris paribus) and then draw the appropriate diagram yourself. Try this now, but if you do have problems then look at the diagrams below.
原来的均衡价格是P1,数量是Q1。我们处于一种 "静止状态"。现在假设需求的决定因素之一发生了变化。例如,该行业的广告可能增加了。这将使需求曲线向右移动,在其他情况下(D2)。价格不会在P1的位置停留太久。我们有一个需求过剩的情况(A到C)。如上所述,这将导致价格被抬高,这将一直持续到我们达到新的平衡价格,即新的需求曲线与供给曲线相交的地方(在B点)。请注意,需求曲线发生了移动,但只是沿着供应曲线移动。供应的决定因素都没有改变。
早些时候,我们把这个过程称为 "价格机制"。从上面的分析中,我们可以看到,价格本身具有最重要的作用。价格上涨对可能想加入这个不断扩大的行业的新公司起到了信号作用。它作为一种激励,鼓励现有企业生产更多的产品(沿着供应曲线的移动)。它还充当了一种配给装置,即它阻止了一些现有的买家,并帮助确保需求与供应相匹配。
你也许可以看到,我还可以画三个图:需求曲线向左移动;供给曲线向右移动和供给曲线向左移动,所有这些都是假设的等价交换。你应该能够想到这些曲线中任何一条可能发生移动的原因(等价交换),然后自己画出相应的图。现在就试试,如果你有问题,就看看下面的图。
Demand curve shifts to the left
需求曲线向左移动
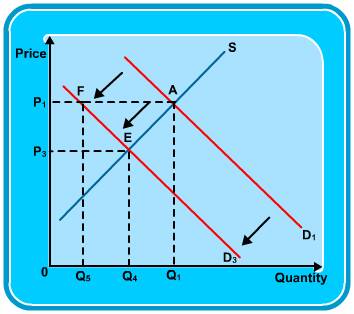
初始平衡:P1, Q1 (A)
新的平衡点:P3, Q4 (E)
为什么需求曲线可能向左移动?
实际收入下降
对该商品的偏好减少
替代品的价格下降
补充物的价格上升
人口数量减少
广告和营销的减少
Supply curve shifts to the right
供应曲线向右移动
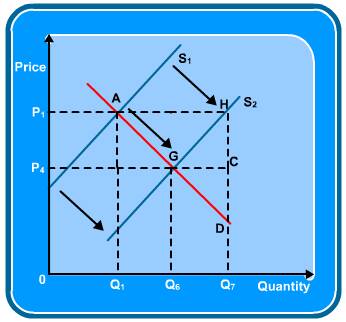
初始平衡:P1, Q1 (A)
新的平衡点:P4, Q6 (G)
为什么供给曲线可能向右移动?
工资成本下降
原材料成本的下降
劳动生产率提高
减少了间接税
补贴增加
技术改进
新公司进入该行业

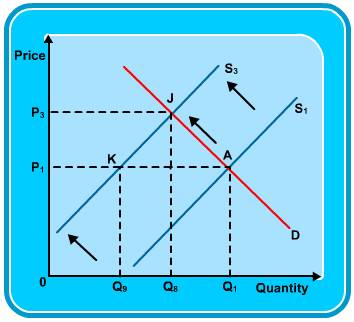
初始平衡:P1, Q1 (A)
新的平衡点:P5, Q8 (J)
为什么供给曲线可能向左移动?
工资成本上升
原材料成本上升
劳动生产率降低
间接税的增加
补贴的减少或取消
现有企业退出该行业
When both curves shift
It is not unreasonable to think of a situation where both the demand and supply curves shift. Think of the market for computers over the last decade or so.
当两条曲线都发生变化时
想到需求和供给曲线都发生变化的情况也不是没有道理的。想想过去十年左右的计算机市场。

The demand curve for computers has definitely shifted to the right for several reasons. Real incomes have risen, there has been a rise in their preferences and the marketing of computers has increased, to name just three factors. But there has also been a huge shift to the right in the supply curve for computers. There have been immense leaps in technology so that any given computer can be produced at a fraction of the cost compared with a decade ago. This can be seen in the diagram above.
The equilibrium price has fallen from P1 to P2, a fairly large relative drop, and the quantity supplied and demanded has also risen hugely, from Q1 to Q2. What actually happens in the market for computers at the moment is that the price remains fairly constant, but for the same price, a given computer gets technically better and better as the months go by.
由于几个原因,计算机的需求曲线肯定已经向右移动了。实际收入增加了,他们的偏好增加了,计算机的营销也增加了,这只是三个因素。但是,计算机的供应曲线也发生了巨大的右移。技术上有了巨大的飞跃,因此任何特定的计算机都可以用十年前的一小部分成本来生产。这可以从上图中看出。
均衡价格从P1下降到P2,这是一个相当大的相对下降,而供应和需求的数量也大幅上升,从Q1到Q2。目前在电脑市场上实际发生的情况是,价格保持相当稳定,但对于同样的价格,随着时间的推移,某台电脑在技术上变得越来越好。

Consumer surplus is officially defined as the welfare, or benefit, a consumer derives from the purchase of a good or service. It is a 'surplus' because it measures, in a sense, the extra 'benefit' they receive because the price they actually pay is less than the price they were willing to pay.
消费者剩余被正式定义为消费者从购买商品或服务中获得的福利,或利益。它是一种 "剩余",因为从某种意义上说,它衡量的是由于他们实际支付的价格低于他们愿意支付的价格而获得的额外 "利益"。
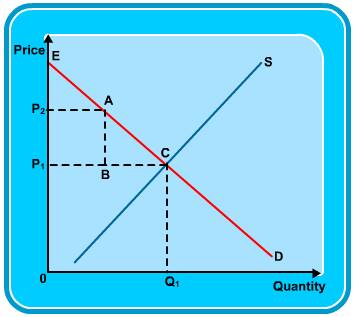
In the diagram above, the equilibrium price is P1 and the equilibrium quantity is Q1. The demand curve shows the value that consumers place on the product in question. If the price is high then there are not many consumers who value the product so highly. When the price is low numerous consumers are prepared to buy the product. Imagine that you are a consumer that is prepared to pay P2 for the product in question. Luckily for you, the market price is only P1, so the difference between the two prices (P2 - P1, or A minus B) is, in a sense, an intangible benefit that you receive. If you went to a newsagent, fully prepared to pay 80p for an ice cream, but for whatever reason the price was only 50p, then, in a way, you have received a benefit of 30p.
If you extend this analysis over all prices, then the total consumer surplus in this market is represented by the triangle P1EC (under the demand curve, above the equilibrium price and to the right of the y-axis). It can be seen; therefore, that if the price rises, for whatever reason, then total consumer surplus will fall, and if the price falls then total consumer surplus will rise.
在上图中,均衡价格是P1,均衡数量是Q1。需求曲线显示了消费者对有关产品的价值。如果价格很高,那么就没有多少消费者对该产品有如此高的评价。当价格较低时,许多消费者准备购买该产品。想象一下,你是一个准备为有关产品支付P2的消费者。幸运的是,市场价格只有P1,所以这两个价格之间的差额(P2-P1,或A减B)在某种意义上是你得到的无形利益。如果你去了一家报社,完全准备为一个冰淇淋支付80便士,但由于某种原因,价格只有50便士,那么,从某种意义上说,你已经得到了30便士的好处。
如果你把这个分析扩展到所有的价格上,那么这个市场上的总的消费者剩余就由三角形P1EC表示(在需求曲线下,平衡价格上方,Y轴的右边)。因此,可以看出,如果价格上涨,不管是什么原因,那么总的消费者剩余将下降,如果价格下降,那么总的消费者剩余将上升。

This concept is similar but refers to producer welfare rather than consumer welfare. Producer surplus is, effectively, producer profit (much more detail in the 'Costs and revenues' topic).
这个概念类似,但指的是生产者福利而不是消费者福利。生产者盈余实际上就是生产者利润(更多细节见 "成本和收入 "专题)。

As we know, the supply curve represents what the producers are willing and able to supply. It is also their marginal cost curve. If a producer is just prepared to supply the Q2th unit, then the cost of producing that unit must be the distance CQ2. But the market price is P1, so the revenue he gains from selling that unit is represented by the distance BQ2. Profit is revenue minus cost, so the producer profit (or producer surplus) is the distance BC.
Again, if one extends this analysis to all units supplied, the total producer surplus is represented by the triangle P1AE (Above the supply curve, below the market price and to the left of the y-axis.)
正如我们所知,供应曲线代表生产者愿意并能够提供的东西。这也是他们的边际成本曲线。如果一个生产者只是准备供应第2个单位,那么生产该单位的成本必须是距离CQ2。但市场价格是P1,所以他从销售该单位获得的收入是由距离BQ2表示。利润是收入减去成本,所以生产者利润(或生产者剩余)是距离BC。
同样,如果把这个分析扩展到所有的供应单位,总的生产者剩余由三角形P1AE表示(在供应曲线之上,市场价格之下,Y轴的左边)。